NYC HOTEL ANALYSIS
This comprehensive analysis identifies patterns in price, room type distribution, and availability across neighborhood
Procedure
- Data Collection: The analysis was conducted using a dataset of NYC Airbnb listings, visualized through Power BI. Metrics included price, availability, reviews, room types, and hosts per neighborhood.
- Exploration: Key factors such as neighborhood group, room type, average price, host activity, and reviews were analyzed.
- Visualization: Graphs and tables illustrated price distributions, availability, host activity, and top-performing neighborhoods.
Tools Used:
- Power BI Desktop for data modeling, visualization, and insights extraction.
- DAX (Data Analysis Expressions) for creating calculated measures and columns.
Aim & Purpose:
The primary objective is to identify patterns in price, room type distribution, and availability across neighborhoods.
This analysis seeks to:
- Uncover price anomalies or significant variations.
- Identify host dynamics and top contributors.
- Highlight high-performing neighborhoods and room types.
Procedure:
- Data cleaning and pre-processing in Power BI.
- Developing calculated measures for price averages, statistical values, and availability.
- Creating visualizations for neighborhood and host-specific insights.
- Cross-verifying findings to ensure data integrity.
Key Insights
Analysis was done to look into three different trends:
- Pricing trends
- Host activities
- Neighborhood listing
Pricing Trends:
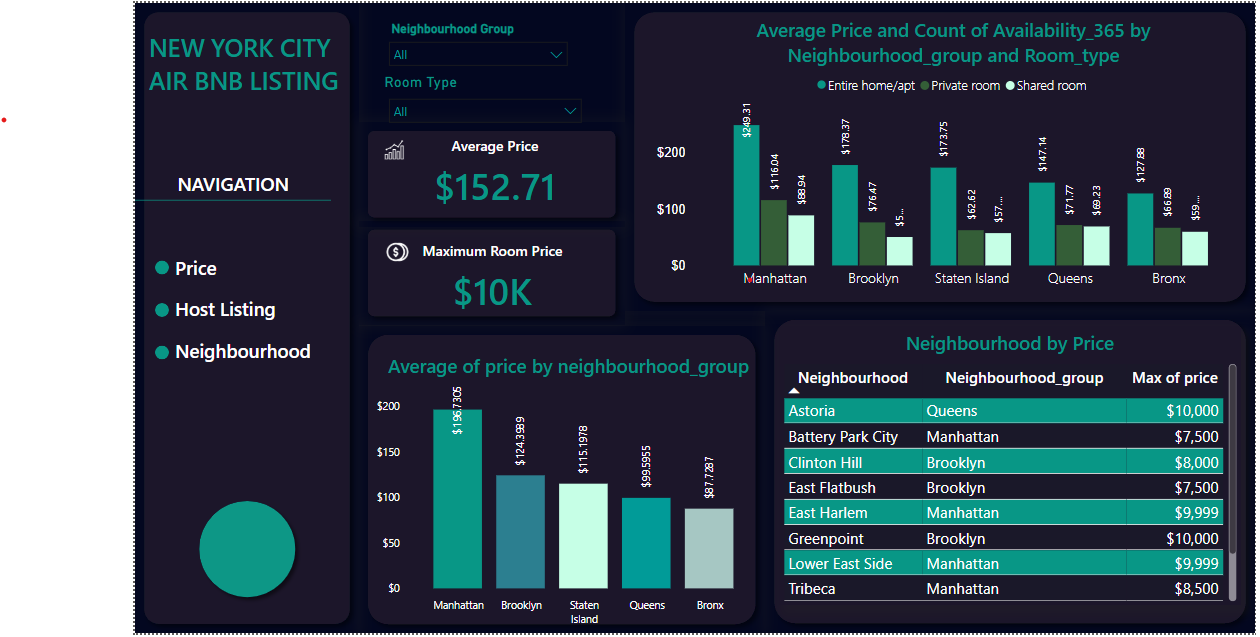
- Average Price & Maximum Room Price
- The average price for Airbnb listings in NYC is $152.71, which indicates a general pricing trend across different neighborhoods.
- The maximum room price reaches $10,000, suggesting that luxury listings significantly impact price variation.
- Entire homes/apartments consistently command the highest prices across all boroughs.
- Private rooms are significantly cheaper but still vary by location.
- Shared rooms are the most affordable option, with prices hovering around $50 – $70, depending on the neighborhood.

Host Activity
Total Number of Hosts
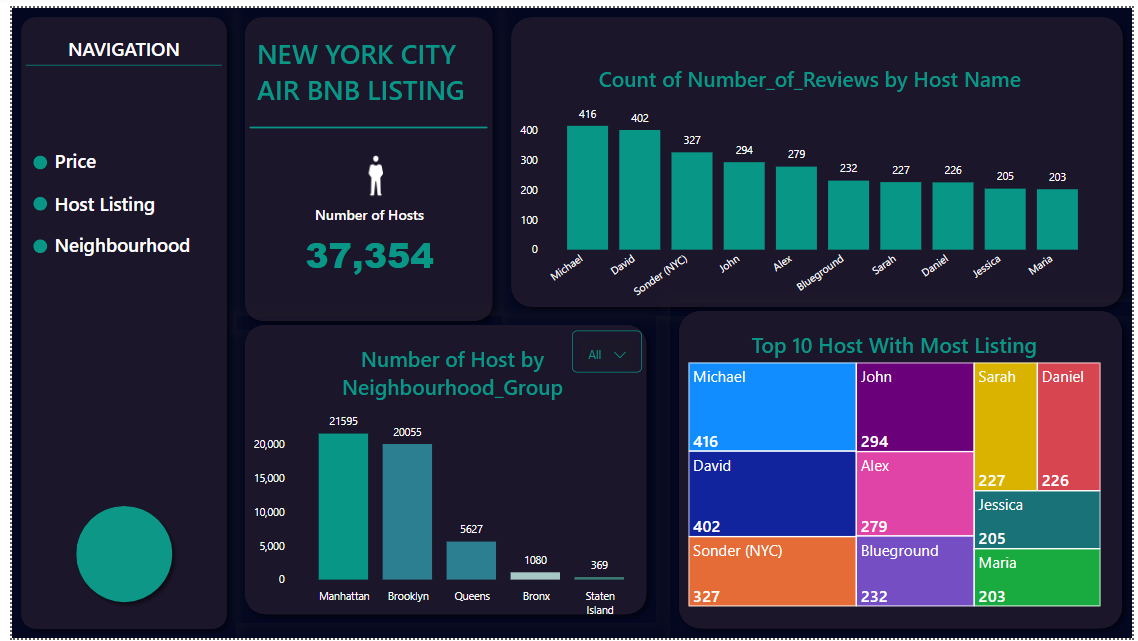
- There are 37,354 hosts managing Airbnb listings across New York City. This indicates a large and competitive short-term rental market.
Host Distribution by Neighborhood Group
- Most hosts are concentrated in Manhattan (21,595) and Brooklyn (20,055).
- Manhattan leads with 21,595 hosts, which is more than half of all hosts in the city. This aligns with its high demand for Airbnb stays due to tourism and business activity.
- Brooklyn follows with 20,055 hosts, showing a strong Airbnb presence, likely driven by its cultural attractions and affordability compared to Manhattan.
- Queens has 5,627 hosts, making it the third most popular borough for Airbnb rentals.
- Bronx (1,080 hosts) and Staten Island (369 hosts) have significantly fewer hosts, indicating lower Airbnb activity, possibly due to lower tourist traffic.
Top Hosts by Number of Listings
- Michael is the top host with 416 listings, followed by David (402 listings) and Sonder (NYC) (327 listings).
- Other notable hosts include John (294), Alex (279), and Blueground (232).
Hosts with Most Reviews
- Michael has the highest number of reviews (416), suggesting a strong customer engagement and possibly high booking frequency.
- David (402), Sonder (NYC) (327), and John (294) also have a high number of reviews, indicating their listings attract a lot of guests.
- This suggests that these hosts may be experienced, have optimized their listings, and are likely earning significant revenue from their properties.

Neighborhood Insights
Average Price by Neighborhood Group
- Manhattan has the highest average price at $196.70 per night, reflecting its premium status due to high tourist demand, luxury accommodations, and central location.
- Brooklyn follows at $124.89 per night, likely due to its growing popularity as a cultural hub while still being more affordable than Manhattan.
- Staten Island ($115.97) has a slightly higher price than Queens ($99.55), despite lower Airbnb activity. This could be due to limited supply, unique accommodations, or proximity to waterfront areas.
- Bronx has the lowest average price at $87.73 per night, suggesting lower demand compared to other boroughs.
. Maximum Nights Allowed by Neighborhood Group
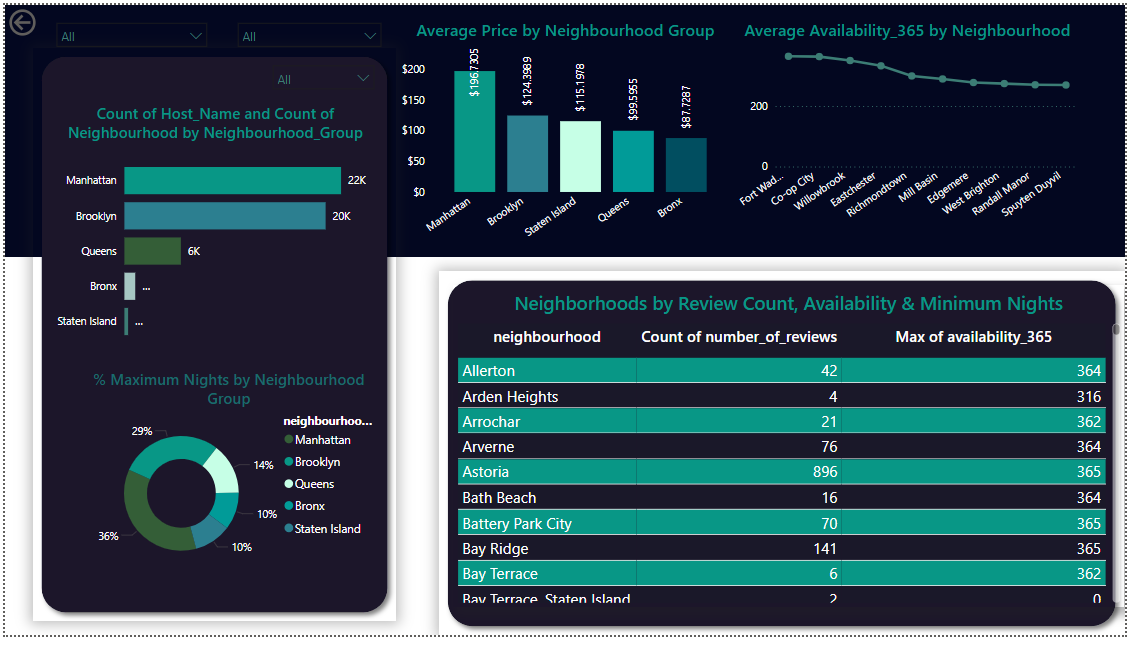
- Manhattan has the highest proportion of maximum night stays (36%), followed by Brooklyn (29%). This suggests that many listings in these boroughs are designed for long-term guests.
- Staten Island, Queens, and the Bronx each account for about 10% of the maximum night stays, indicating fewer long-term stay options.
- Room Type Distribution:
- Entire homes/apartments have the highest prices, particularly in Manhattan.
- Shared rooms generally feature the lowest average prices.

Recommendations
Pricing
- Entire homes/apartments yield the highest revenue. Investing in fully furnished spaces in high-demand areas (e.g., Manhattan and Brooklyn) can be profitable.
- Private rooms offer a balanced pricing approach for hosts who want steady bookings without full property rentals.
Seasonal Pricing Adjustments
- Given the high price variations, dynamic pricing tools should be used to adjust rates based on demand trends (e.g., peak tourist seasons, events, and holidays).
- Hosts
Target Emerging Markets:
- Manhattan and Brooklyn are competitive, so new hosts could focus on Queens, the Bronx, or Staten Island, where there is less competition but growing demand.
- Properties near subway stations, airports, and key attractions in these boroughs can attract more bookings.
Enhance Guest Experience to Gain More Reviews:
- Positive reviews boost visibility and trust. Providing excellent service, quick responses, and high cleanliness standards can lead to more reviews and better rankings.
Optimize Pricing & Listings:
- Competitor analysis is key. New hosts should set competitive prices to attract bookings and optimize their listings with high-quality images and detailed descriptions.
Leverage Unique Selling Points (USPs):
- Offering unique stays such as family-friendly, pet-friendly, or business-oriented properties can differentiate small hosts from corporate Airbnb operators.
Strategic Investment:
- Focus on Manhattan and Brooklyn for high returns, particularly in neighborhoods like Tribeca and Sea Gate.
- Consider Staten Island for emerging opportunities due to its high-priced listings like Fort Wadsworth.
Optimizing Listings:
- Hosts should target entire homes/apartments to capitalize on premium pricing.
- Improve marketing in underperforming neighborhoods with high availability but low reviews.
Policy Adjustments:
- Encourage short-term stays in areas like the Financial District to cater to more travelers.
- Offer discounts or incentives in low-review neighborhoods to boost visibility.
Customer-Centric Strategies:
- Highlight unique neighborhood features in marketing to attract diverse clientele.
- Utilize high-performing hosts like Michael as a benchmark for listing optimization.
Conclusion
- Strategic pricing, location-based investment, and leveraging seasonal demand can significantly improve profitability for Airbnb hosts.
- Manhattan and Brooklyn dominate the Airbnb market, but Queens and the Bronx present growth opportunities.
- Manhattan remains the most expensive borough, while the Bronx is the most affordable.
- Top hosts are either experienced individuals or professional rental businesses.
- New hosts should focus on excellent service, competitive pricing, and strategic locations to build a successful Airbnb business.
- Larger hosts should explore expansion, automation, and branding to maintain profitability in a competitive market.
- Full-time Airbnb businesses are concentrated in areas like Fort Wadsworth and Randall Manor, with year-round availability.
- Strategic pricing, availability optimization, and improved marketing can help hosts maximize revenue and occupancy.
