HR DATA CLEANING & VALIDATION PROCEDURE
Data cleaning is a crucial step in data analysis. Messy data can lead to inaccurate insights, making it essential to clean and structure it properly before analysis. ne common issue is when all information is crammed into a single column instead of being properly categorized into multiple columns. This often results from concatenation, where multiple pieces of data are joined together in a single field, making parsing necessary to extract meaningful insights.
In this portfolio, I will walk through a real-world data cleaning procedure where we take data stored in one column and split it into multiple relevant columns using Power Bi.
Tools Used:
- Power BI (Power Query Editor) – For data cleaning and transformation
- DAX (Data Analysis Expressions) – For additional calculations
Aim & Purpose:
The primary aim of this project was to clean and structure HR data to a ready-to-analyze data to uncover insights related to employee attrition, travel frequency, department distribution, and salary patterns. By transforming raw data into an analyzable format, HR managers can use this information to make informed decisions.
Key Insights (Step-by-Step Process)
1. Identifying Dirty Data
- The dataset was initially stored in a single concatenated column, making it unreadable.
- Mixed data types were present in a single field (e.g., numerical and categorical values combined).
- Some values had extra spaces, missing values, or inconsistencies (e.g., “Travel_Rarely” vs “Travel Rarely”).
2. Parsing & Splitting Columns
- A concatenated data can neither be used or analyzed. So, the data needs to be parsed using the split column on the menu.
- Used “Split Column by Delimiter” in Power Query Editor to separate the combined column into multiple structured fields.
- Split column – By delimiter – Tab (Each occurrence of the delimiter) – click okay – Use first row as header. This procedure splits the column appropriately.
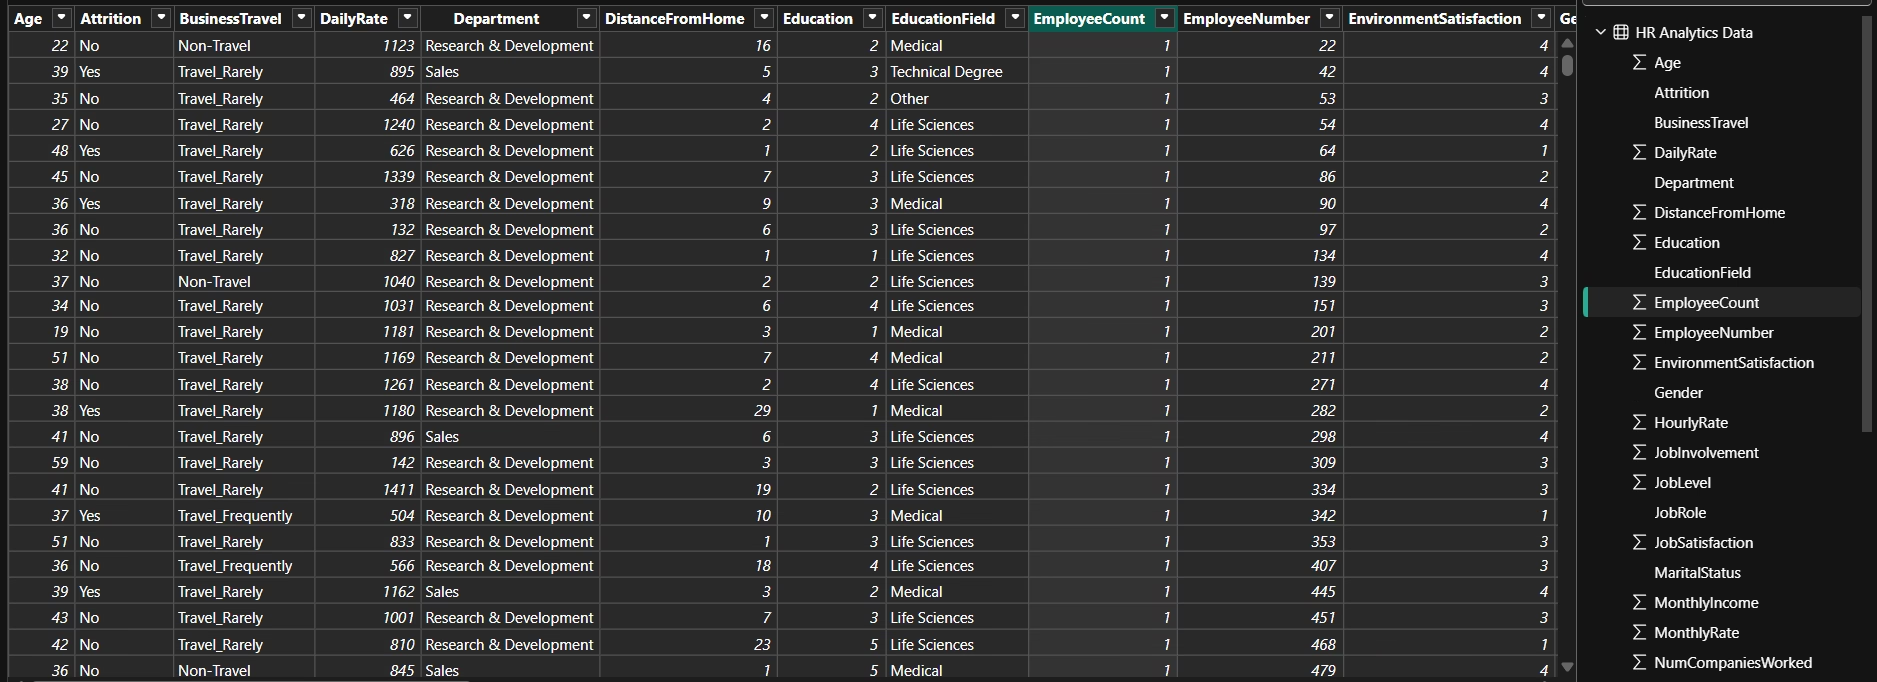
- Ensured each column represented only one type of data (e.g., Age, Business Travel, Daily Rate, etc.)
3. Handling Data Types
- Converted Age, Daily Rate, and Distance from Home to numerical formats for proper calculations.
- Standardized categorical variables like Department and Business Travel to avoid inconsistencies.
4. Cleaning Dirty Data
- Trimmed extra spaces and removed unnecessary characters in categorical fields.
- Standardized text formatting (e.g., ensuring “Research & Development” appeared consistently instead of variations like “Research and Development”).
- Some values had extra spaces, missing values, or inconsistencies (e.g., “Travel Rarely” vs “Travel_Rarely”).
5. Handled missing values
- Categorical values: Replaced missing entries with the most common category (mode).
- Numerical values: Used median values to fill missing data where applicable.
6. Filtering and Sorting
- Removed duplicate entries to maintain dataset integrity (from 18700 rows to 16750 rows)
- Filtered irrelevant rows (e.g., employees with missing IDs or unrealistic salary values).
- Sorted data by Attrition, Travel Frequency, and Salary to identify trends.
7. Exporting and Preparing for Analysis
- Verified that all transformations were applied correctly.
- Exported the cleaned dataset, making it ready for HR analytics and visualization.
Summary:
This HR analytics data transformation project aimed to clean, structure, and prepare the dataset for meaningful analysis. Initially, the dataset was unstructured, with multiple attributes stored in a single concatenated column. Through parsing, splitting, and handling data types, the data was restructured into an analyzable format.
Key steps included removing inconsistencies, handling missing values, standardizing categorical data, and filtering out irrelevant entries. Sorting and filtering helped refine the dataset.
By applying these data transformation techniques in Power BI’s Power Query Editor, the dataset is now clean, structured, and ready for further analysis. This ensures that HR professionals can derive accurate insights into attrition rates, employee travel patterns, salary distribution, and departmental trends, ultimately aiding in data-driven decision-making.
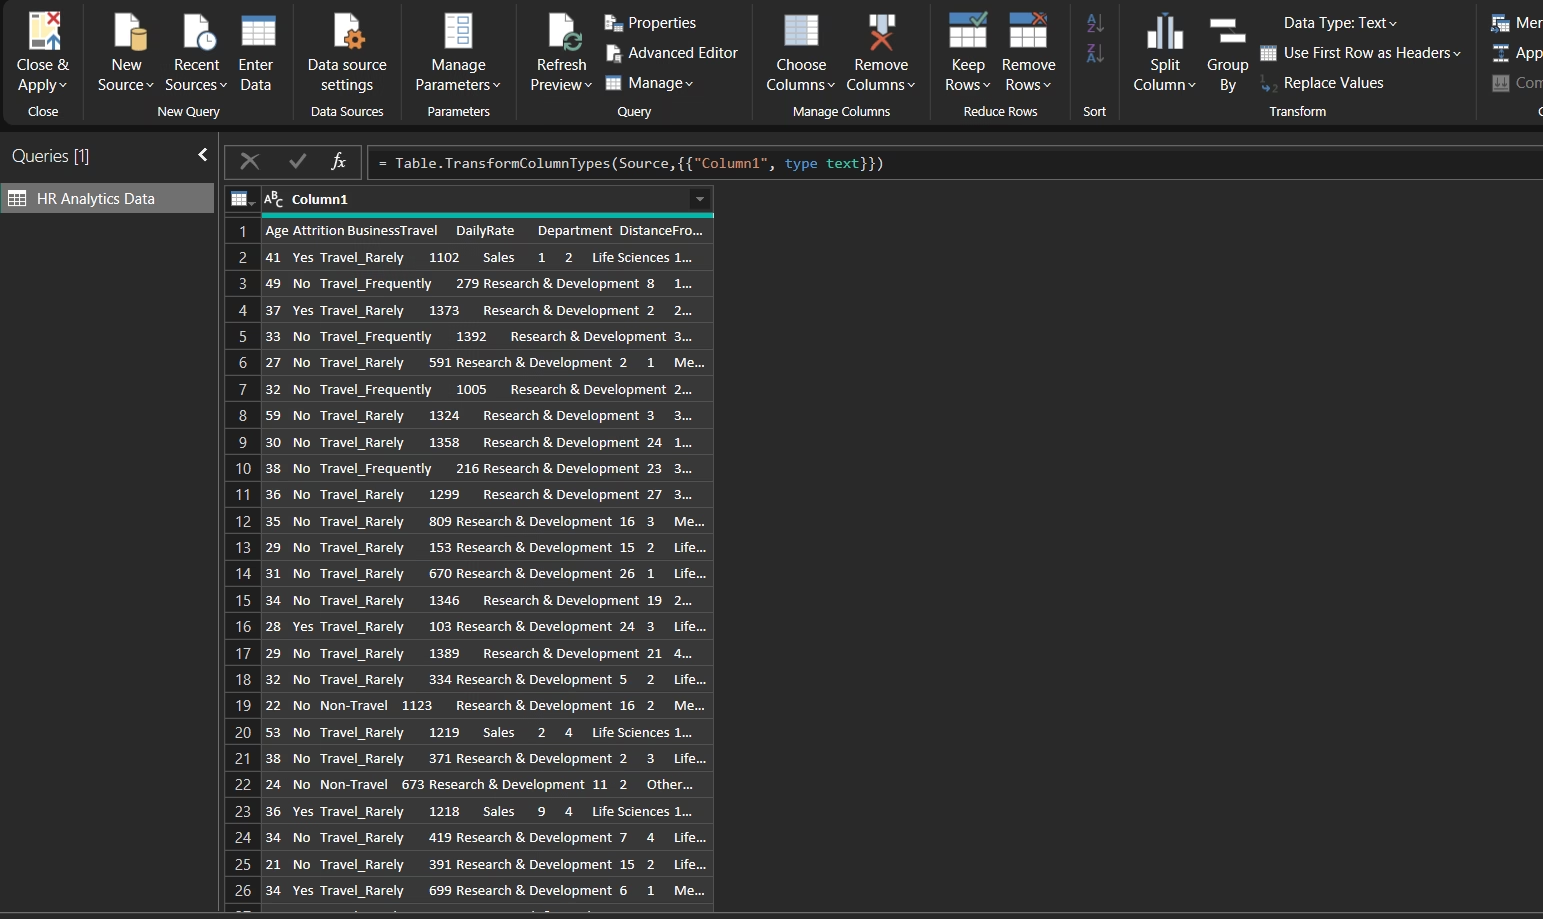
Data Cleaning – Dirty Data (Concatenate)
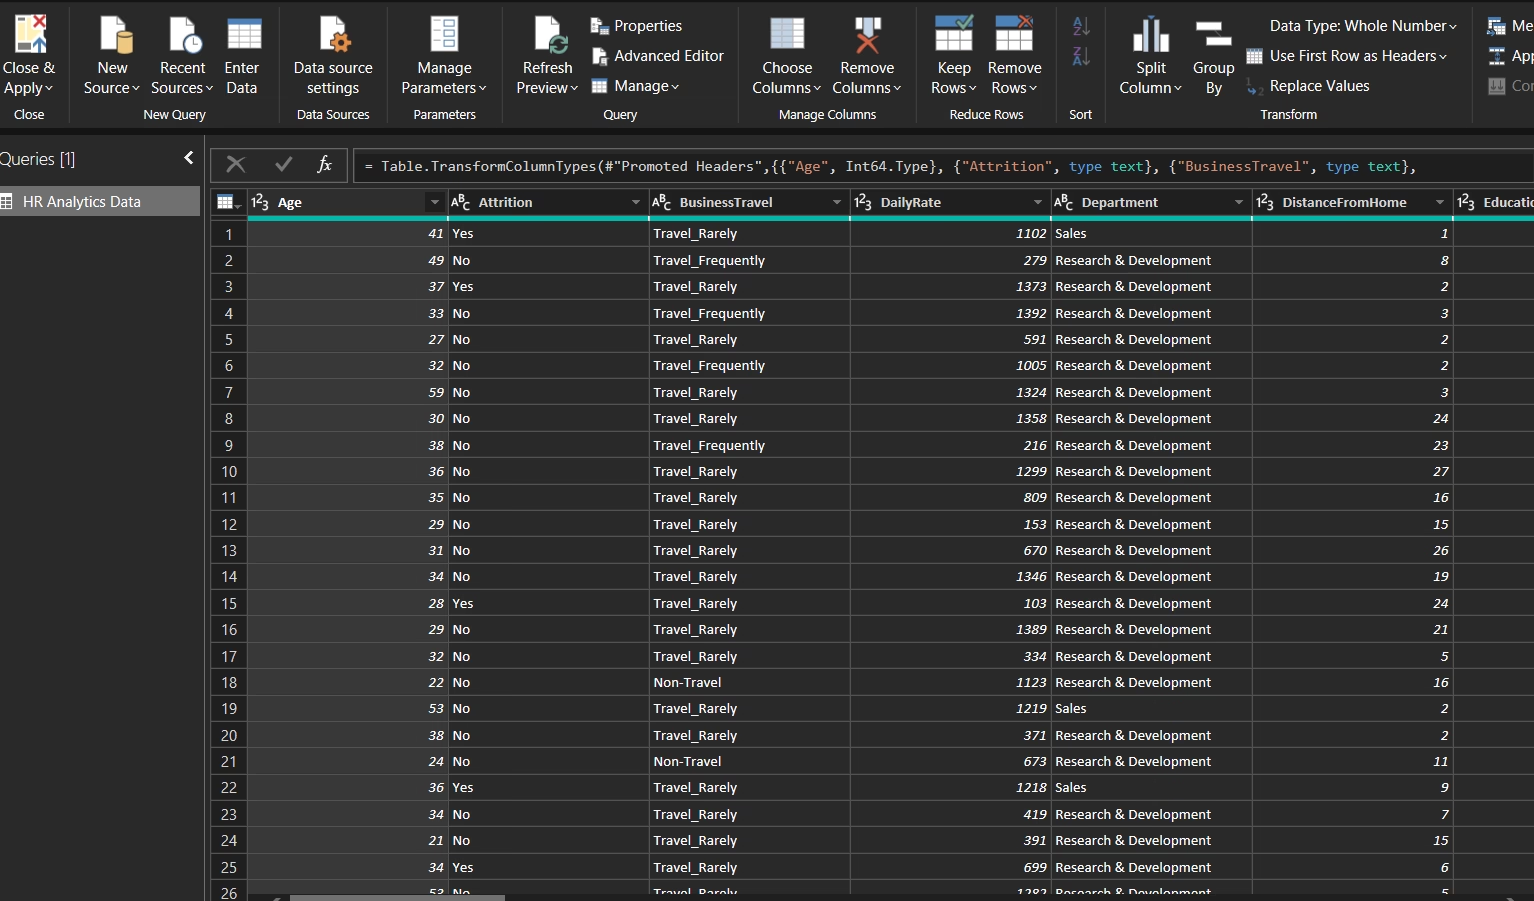
Cleaning Data -Parsing