DOLLE FOOD PRODUCTION COMPANY ANALYSIS & INSIGHTS
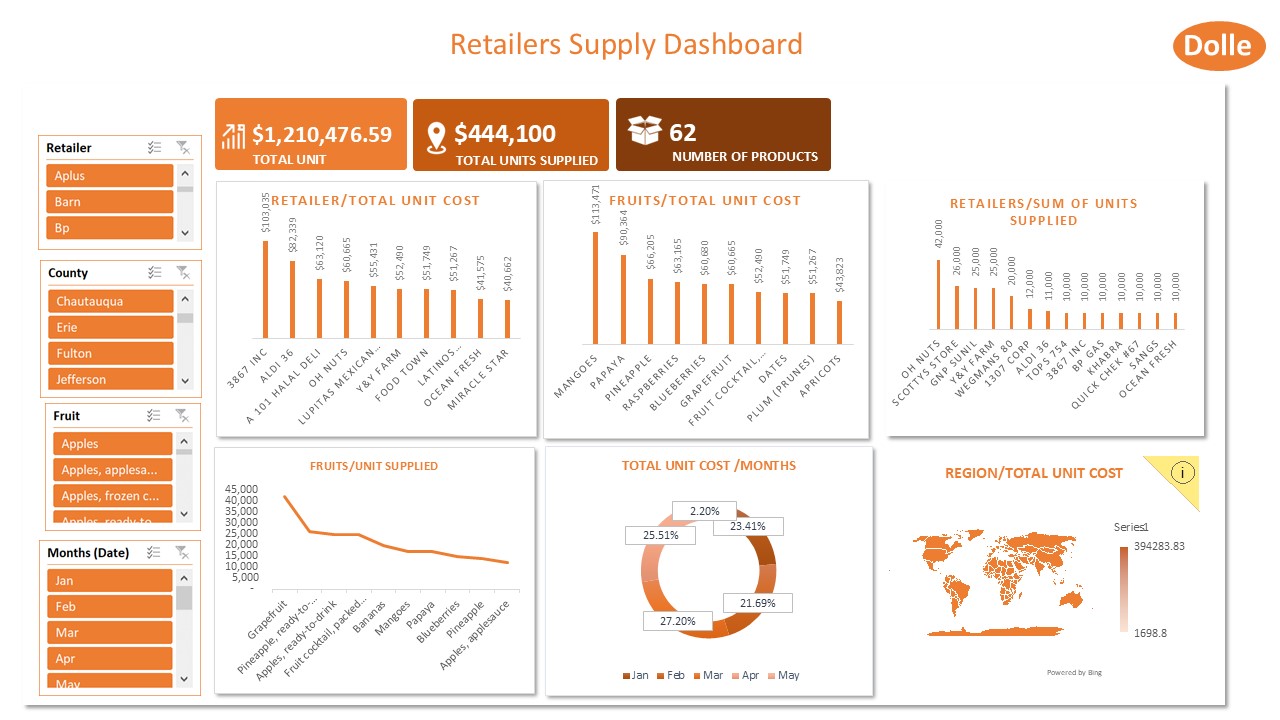
The dashboard comprehensively analyzes the retailer’s performance and supply chain data to provide a clear and actionable overview of key metrics, trends, and opportunities.
By leveraging data-driven tools to gain valuable insights into areas such as:
- Retailer performance and cost efficiency
- Product profitability and demand
- Supply chain bottlenecks and optimization opportunities
This presentation will delve into the key findings from the dashboard, highlighting areas of strength and areas where improvements can be made.
Ultimately, the goal is to provide actionable recommendations to optimize operations, increase profitability, and drive growth.”
Tools Used:
- Microsoft excel for data collection, data cleaning, formulas and data extraction.
- Pivot table for creating insights and dashboard.
- Powerpoint presentation: For visual representation of the data and findings for informed decison.
Process:
- Data Collection: Collected sales data from multiple sources including CSV files and databases.
- Data Cleaning: Handled missing values and inconsistencies, corrected data types, units and removed duplicates.
- Data Analysis: Conducted exploratory data analysis to identify sales trends and patterns.
- Visualization: Created visualizations to highlight key insights.
- Recommendation: Provided suggestive recommendations to improve sales and track progress.
Key Insights
Which fruits are consistently high performers across retailers?
Based on the “FRUITS/UNIT SUPPLIED” shows the following fruits, which could be consistently high performers throughout the year:
- Grapefruit at 42,000 units supplied.
- Pineapples (Ready-to-drink and possibly regular pineapples based on the label) at 26,000 units supplied.
- Apples (Ready-to-drink and possibly regular apples based on the label) at 25,000 units supplied.
Factors that may have caused these fruits to stand out:
- Relatively Consistent Supply and availability: Their supply lines appear to have the least fluctuation throughout the timeframe shown in the chart, suggesting consistent availability throughout the year.
- Long Shelf Life: They have a longer shelf life, allowing for more consistent stockpiling by retailers.
- High Demand: This fruit are targeted at a partular set of people hence, the high demand.
What is the sales trend in the past months (January-May)
The most prominent feature is the clear downward trend in the doughnut chart segments (slices) size from January to May. This indicates a decrease in total fruit supplied to retailers across these months.
This is due to:
- Seasonal changes in consumer preferences
- Promotions for other products at the retailers
- Changes in retailer buying strategies
Summary
Sales Performance:
- Significant sales growth observed.
- Grapefruit, pineapples, and apples are consistently high-performing products.
Retailer Performance:
- 3867 INC has the highest total unit cost of products sold, indicating high-volume purchases.
- OH NUT tops the chart in the sum of units supplied.
- Seasonal variations affect supply and demand.
Cost Efficiency:
- Fluctuations in total unit costs from January to May
Recommendations
Geographic Analysis:
- Identify the region with the highest total unit cost and investigate the reasons behind it.
- Consider expanding into regions with lower costs or higher demand.
- Establish partnerships with local retailers and distributors to strengthen market presence and distribution networks. Prices can be enticing either by giving promo or discount.
Product Focus:
- Boost production and supply of consistently high-performing fruits like grapefruit, pineapples, and apples to meet demand and maximize sales.
- Maintain or increase production of Apples, frozen concentrated to meet high demand.
- Evaluate the demand and profitability of other fruits to optimize the product mix.
Cost Optimization:
- Offer seasonal promotions and special offers to products with lower unit costs and ensure that supplies is higher so that it is readily available.
- Strengthen relationships with key suppliers to ensure a steady supply of raw materials and negotiate better pricing terms.
- Implement advanced inventory management systems to monitor stock levels and demand forecasts.

